Recruiting Metrics: The Formulas, and What Each One Hides
The recruiting metrics that get used - quality of hire, cost per hire, time to fill vs time to hire and recruitment KPIs - with the formula for each.
Shorten time to first slate - source, verify and score in one pass.
Most recruiting metrics articles are a list of definitions with no arithmetic and no warnings. This one is the opposite: the formula for each metric, worked plainly, plus the specific thing that metric hides - because every recruiting KPI on this page can be improved by doing something stupid, and knowing which stupid thing is the whole skill.
What is time to fill, and how is it different from time to hire?
Time to fill is the days from a requisition being approved to a candidate accepting the offer. Time to hire is the days from a candidate first entering your process to that same acceptance. Time to fill measures the whole role; time to hire measures the candidate's journey through it.
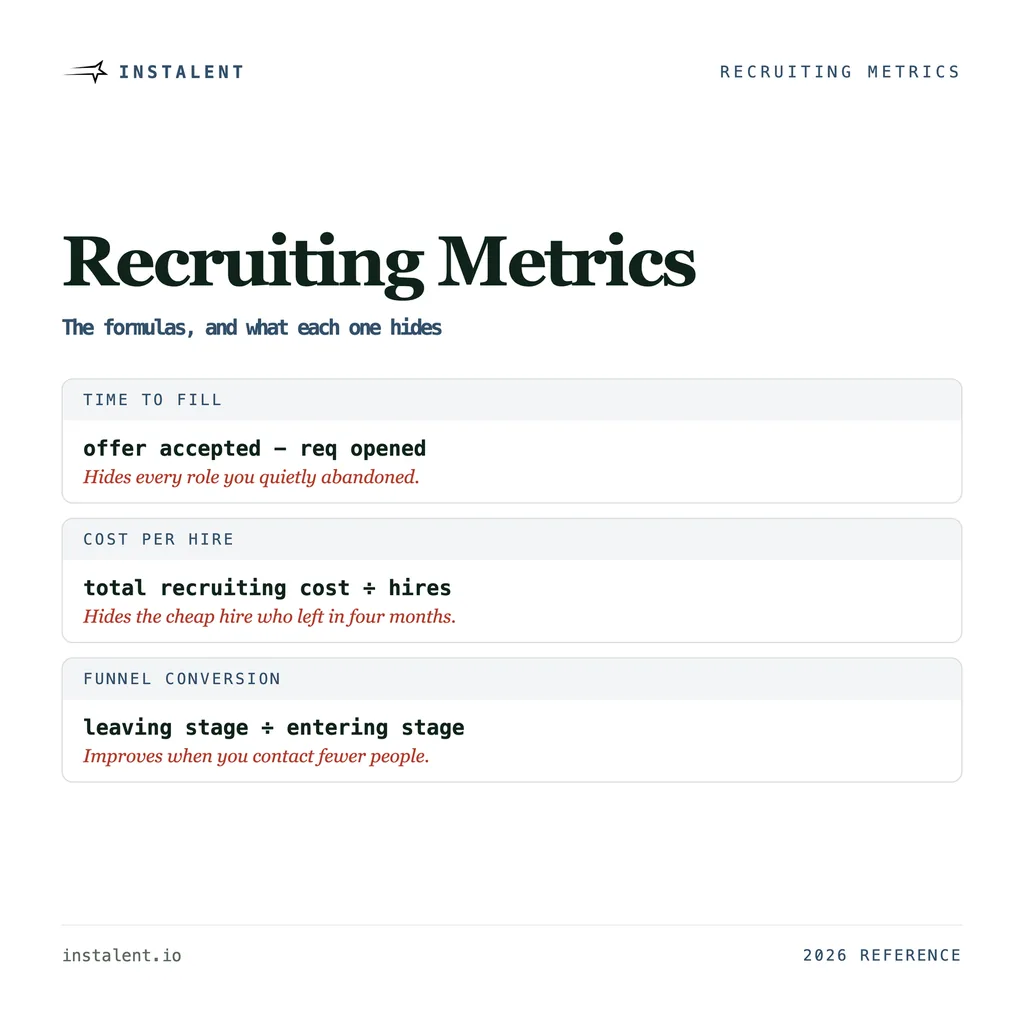
Time to fill  = date offer accepted  -  date req opened
Time to hire  = date offer accepted  -  date candidate first engaged
The difference between the two numbers is the interesting part: it is how long the role sat before you found the person who took it. A firm with a 40-day time to fill and a 12-day time to hire does not have a slow process - it has a slow start.
What it hides: both are measured only on roles that closed. Every req you abandoned is excluded, so a desk that quietly drops hard roles posts excellent numbers.
What is quality of hire, and what is the formula?
Quality of hire is the measure of how well a hire actually worked out, scored after they start rather than at offer stage. There is no single agreed formula, which is exactly why it gets skipped. The workable version is a weighted blend of things you already record:
Quality of hire = (performance score
                 + ramp-to-productivity score
                 + hiring manager satisfaction
                 + retention at 12 months) / 4
Weight them however your business actually cares, keep the weights fixed, and score at a set point - 6 or 12 months. The absolute number is close to meaningless; the trend across sources and recruiters is not.
What it hides: it is lagging by a year, and it measures the whole employment experience, not just your hiring decision. A great hire under a bad manager scores badly.
How do you calculate cost per hire?
Cost per hire = (internal recruiting costs + external recruiting costs)
                / number of hires in the period
Internal is recruiter salaries, referral payouts and the share of tooling that serves hiring. External is agency fees, job ads and assessments. Pick the period first and hold it - mixing a quarter's costs with a year's hires produces a number that flatters you by 4x.
What it hides: it treats every hire as equivalent. A cheap hire who leaves in four months costs vastly more than the number says, which is why cost per hire is only safe to read next to quality of hire and first-year retention.
What are the recruiting funnel metrics that matter?
The funnel is a chain of pass-through rates, and the only useful way to read it is stage to stage:
Stage pass-through = candidates leaving stage / candidates entering stage
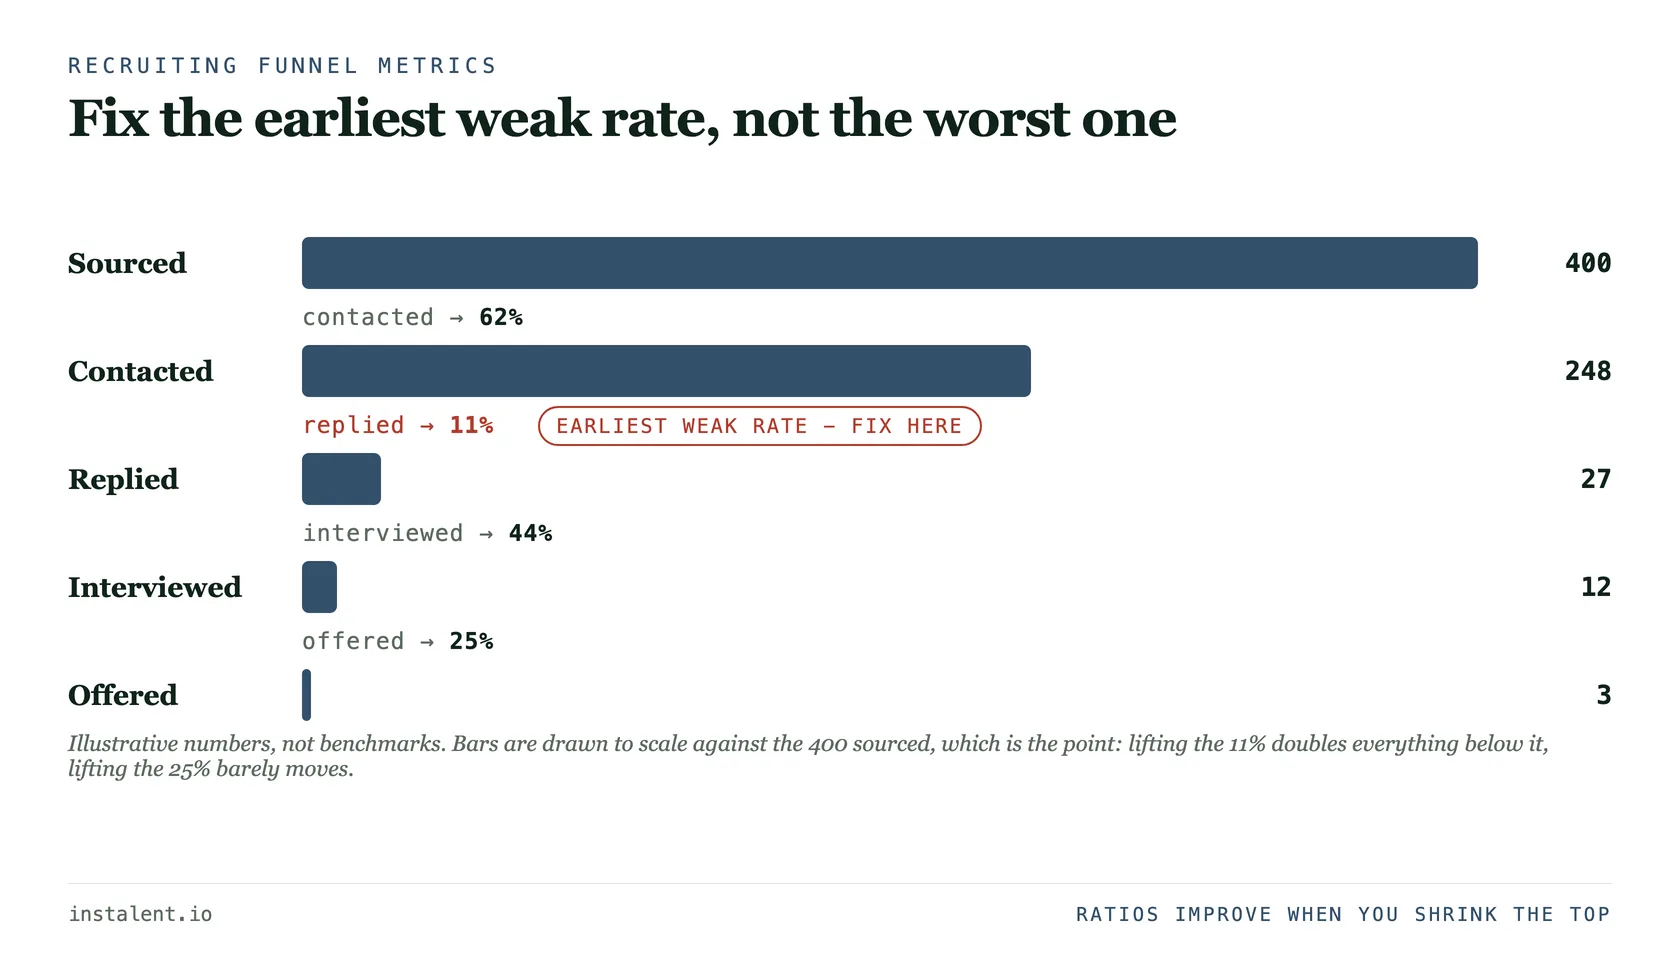
Track reply rate, reply-to-interview, interview-to-offer, and offer acceptance. The discipline is to find the earliest stage that is underperforming and fix that one, because every improvement downstream is multiplied by the leak above it.
What it hides: funnel rates are ratios, so they improve when you shrink the top. A recruiter who contacts only the ten most obvious people will post beautiful conversion rates and a thin slate.
Every metric here can be gamed by doing less
Time to fill improves if you drop hard roles. Cost per hire improves if you stop sourcing and wait for applicants. Funnel conversion improves if you contact fewer people. Pass-through improves if you submit only safe candidates. This is why no single recruiting KPI should ever be a target on its own - always pair a speed or efficiency metric with a quality or volume one.
What is offer acceptance rate, and what is a realistic one?
Offer acceptance rate = offers accepted / offers extended
Worth measuring because it is the metric that most often reveals a problem that started much earlier. In Bullhorn's 2026 GRID report - nearly 2,300 recruitment professionals - firms report two to three of every five candidates rejecting offers. If that is near your reality, a process built to produce exactly one acceptable candidate converts to a placement roughly half the time.
What it hides: a rejected offer is almost always a conversation that did not happen on the first call - compensation, counter-offer risk, competing processes. Acceptance rate is a top-of-funnel measurement wearing a bottom-of-funnel costume.
Reading these numbers together
A formula gives you a fact. What makes the fact useful is the comparison next to it - the same number over time, or split by source, recruiter, req type or client. That practice has its own name and its own failure modes, and recruitment analytics covers them, including why the data usually breaks before it reaches any dashboard.
The two segmentations that pay for themselves fastest:
- Fill rate split by role type - exclusive or engaged versus one of several. Most desks have never split it, and the gap usually ends the argument about which roles to accept.
- Placements from people you already knew versus from cold search. This is the number that tells you whether your database is an asset or an archive.
The set worth actually tracking
Five to eight, not twenty. A defensible starting set:
| Metric | Formula in one line | Pair it with |
|---|---|---|
| Time to fill | Offer accepted minus req opened | Fill rate |
| Time to first slate | First shortlist sent minus req accepted | Slate quality |
| Cost per hire | Total recruiting cost / hires | Quality of hire |
| Offer acceptance rate | Accepted / extended | Time to hire |
| Quality of hire | Weighted blend, scored at 6-12 months | First-year retention |
| Funnel pass-through | Per stage, leaving / entering | Volume contacted |
Speed metrics have a floor set by how much of the work is already done before the role lands. In the same GRID data, 56% of top-performing firms report placing in under ten days and 22% in three days or less - which is not a faster version of the normal process but a different one, where the market was mapped and the contacts verified before the req existed.
Want time to first slate to be the metric you brag about? Get started - Instalent sources across sources rather than one index, verifies contacts and scores fit with the evidence shown, so the slow start disappears.
Related reading: the hiring process covers why elapsed time is mostly gap time rather than stage time, interview questions to ask candidates covers the stage most of these metrics pass through, recruitment agency growth strategy for 2026 is the strategy layer above these numbers - which levers to pull once you can see them - candidate engagement goes deeper on the four that measure whether candidates are actually responding, and talent mapping is how firms get time to first slate down before a role exists.
Sources
- Bullhorn GRID 2026 Industry Trends Report - nearly 2,300 recruitment professionals, fielded November to December 2025
Find better candidates, faster
Source, verify and reach candidates on one engine. Get 25% off your first month.
Keep reading