Outbound Recruiting in 2026: More Applications, Slower Hires
Applications per job doubled and time-to-fill still rose 37%. The 2026 data on why outbound recruiting beats inbound, and how to run an outbound desk.
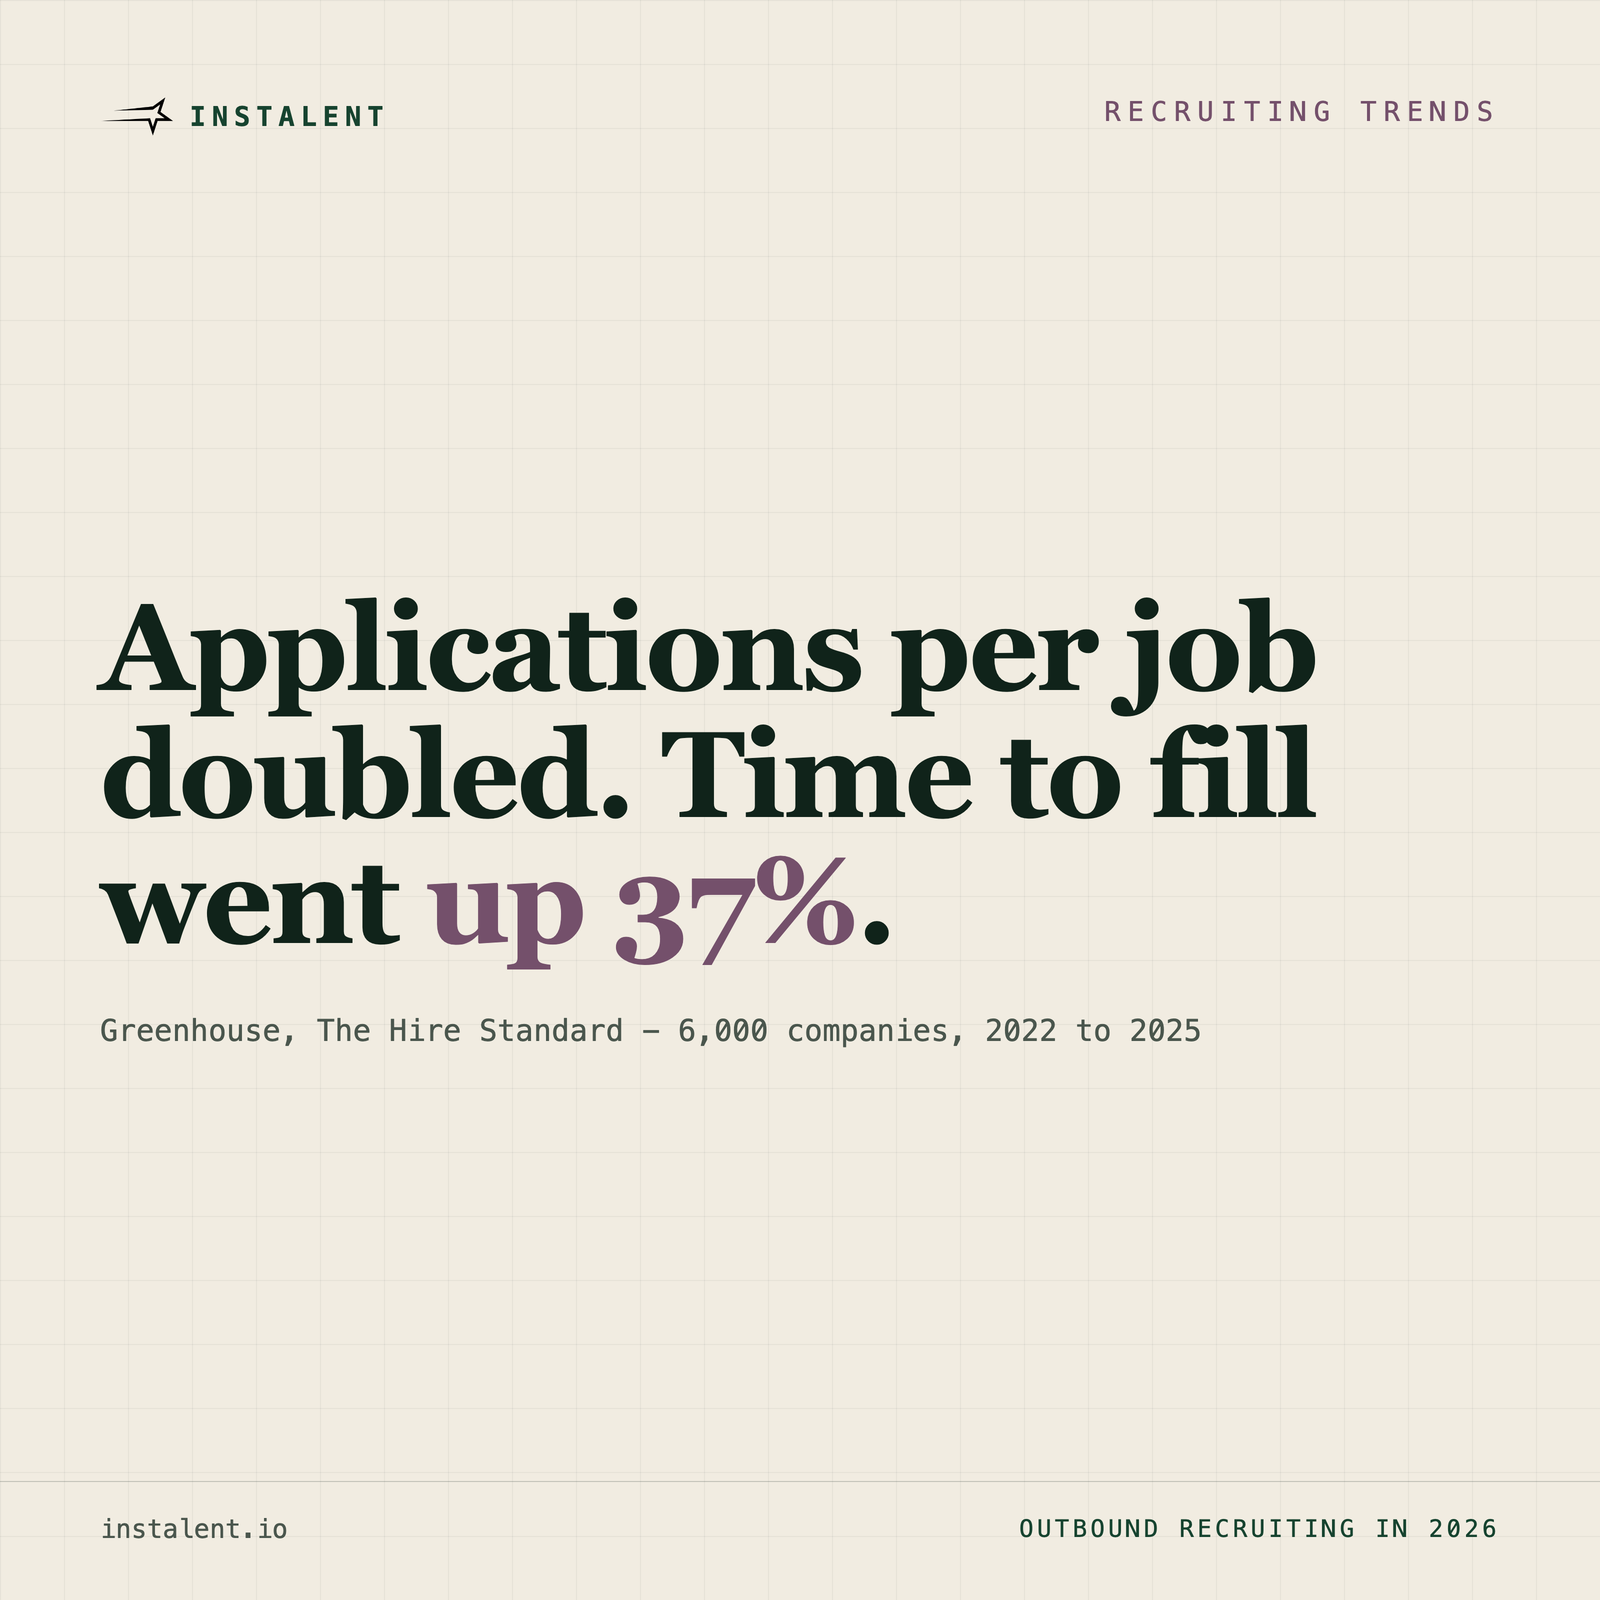
Inbound did not dry up. It doubled. Applications per job went from 116 to 244 in three years, and hiring still got slower - time-to-fill rose 37% over the same period. That one pair of numbers should settle the post-and-pray argument on your desk. The extra volume did not buy speed. It bought screening work. Here is what the 2026 benchmark data actually says about outbound recruiting, and how to run an outbound desk when your team is half the size it used to be.
Every sourcer can feel the flood. Reqs that used to return a stack you could read through now return a pile you can only sample, and a growing share of it is machine-written. What is new in 2026 is that the flood is measured, at scale, by the ATS vendors who see the whole funnel. The numbers are worse than the anecdote, and they point somewhere specific: the channel producing almost all of your applications is not the channel producing your hires.
The inbound channel doubled and hiring slowed down
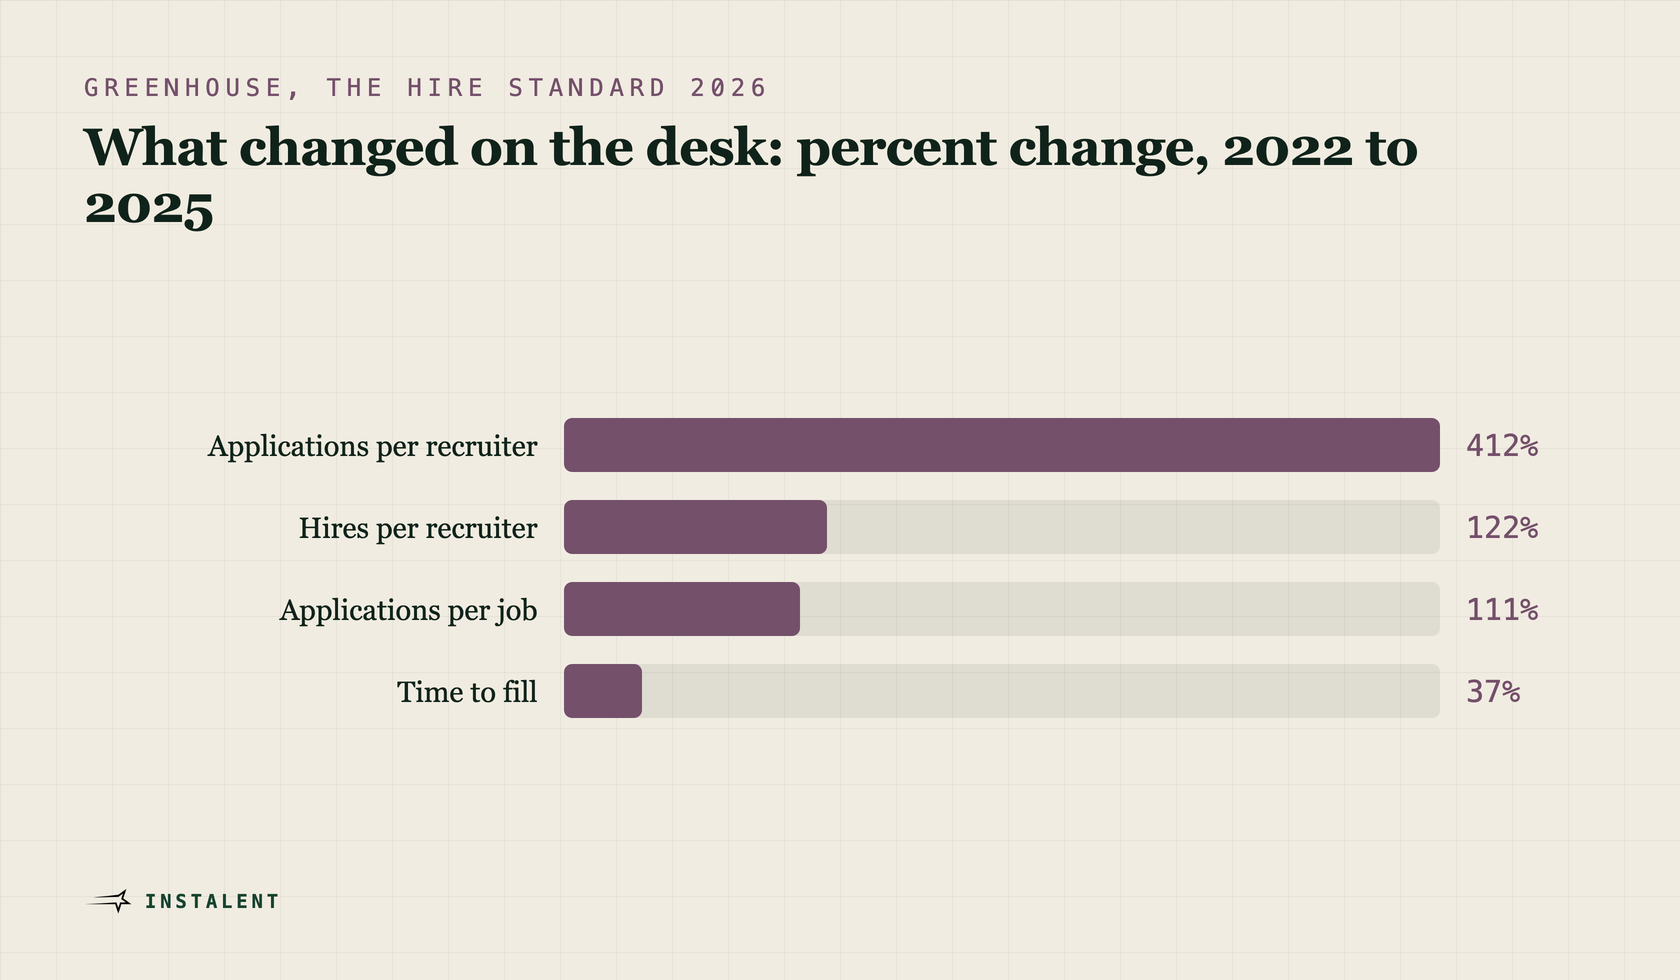
Greenhouse's March 2026 hiring benchmark report covers over 6,000 companies and 640 million applications from 2022 to 2025. Four lines tell the whole story:
- Applications per job: 116 to 244 (+111%)
- Applications per recruiter: 146 to 746 (+412%)
- Recruiting team size: 10.4 recruiters to 4.6 (-56%)
- Time-to-fill: 43.6 days to 59.7 (+37%)
Volume more than doubled, headcount more than halved, and the search still takes sixteen days longer than it did in 2022. Ashby's May 2026 analysis of 100 million applications across 200,000 jobs lands in the same place: open roles now average more than 300 applications, and applications per hire have tripled since 2021.
If application volume were signal, time-to-fill would have collapsed. It went the other way. That is the definition of noise.
The yield math behind outbound recruiting
Gem's 2026 Recruiting Benchmarks Report, published December 2025, sits on 165 million applications and 1.2 million hires from June 2021 to May 2025. It splits the funnel by source, and the split is brutal:
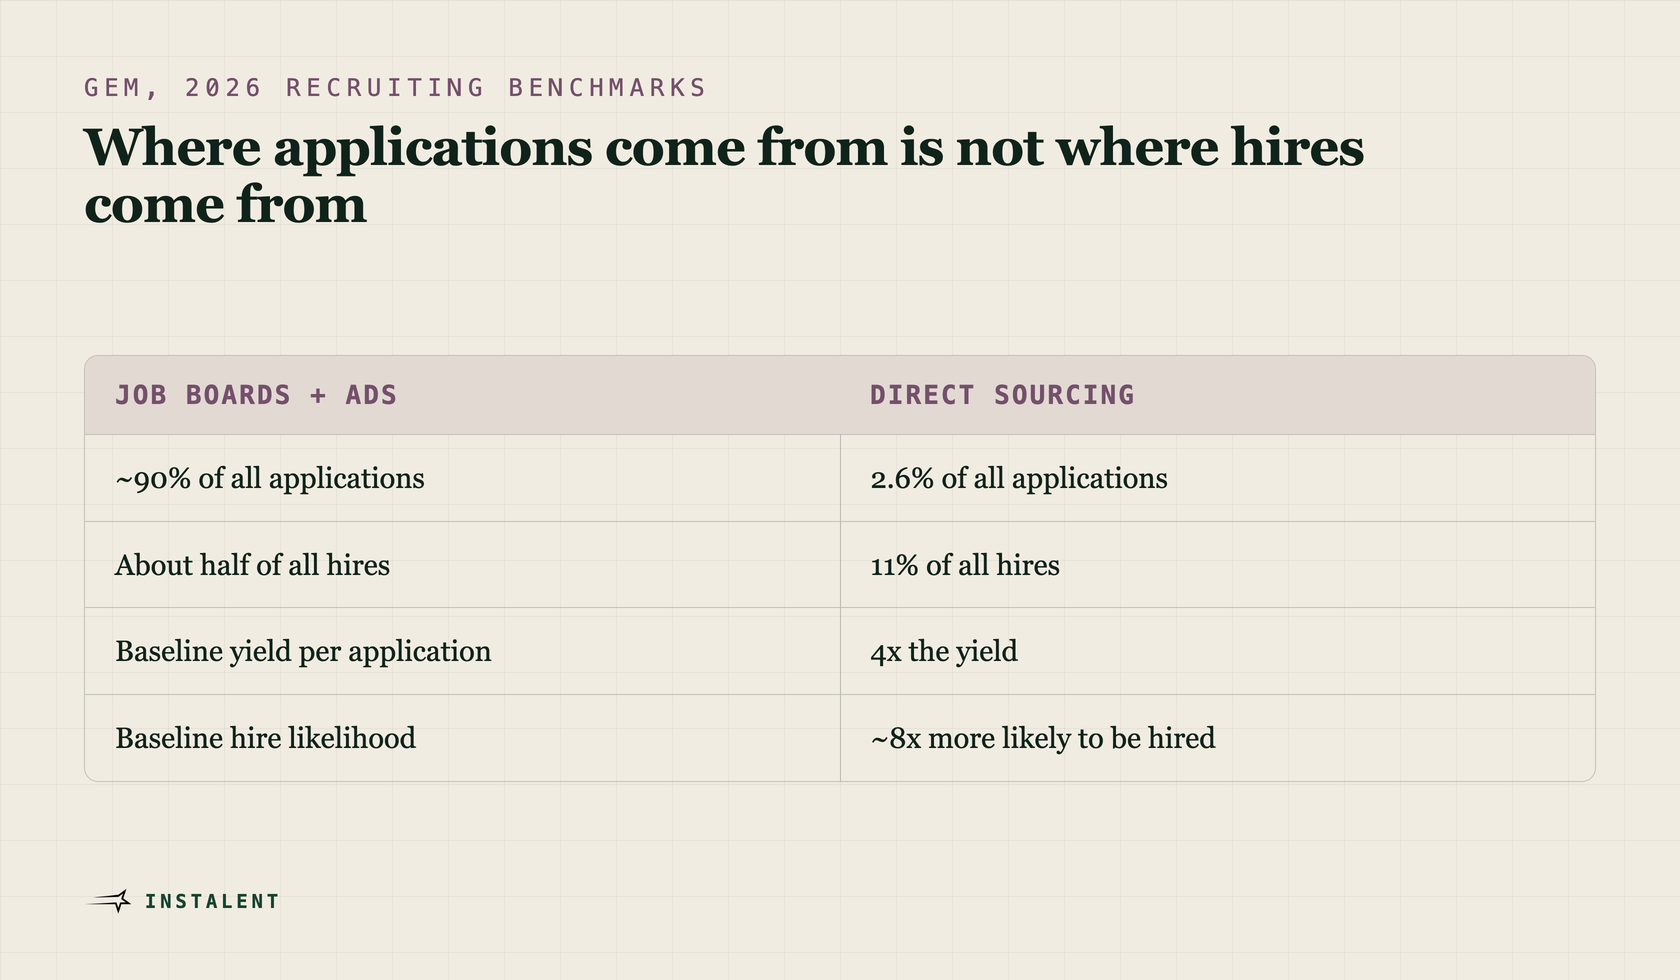
- Job boards and marketing channels produce roughly 90% of all applications and only about half of all hires.
- Direct sourcing produces 11% of hires from just 2.6% of applications - a 4x yield.
- Sourced candidates are nearly eight times more likely to be hired than inbound applicants.
- 0.5% of applicants receive an offer. That is one hire per 200 applications.
- Only 8% of applicants get past the initial screen.
Read those together and the picture is an inverted funnel. Ninety percent of the input carries half the output. The 2.6% you go and find yourself carries a fifth of that half. Outbound recruiting is not a philosophy on this data. It is the higher-yield half of a two-channel desk that most teams still fund at a fraction of the job-board line.
What the flood does to the rest of your funnel
The cost of inbound is not the job ad. It is everything downstream of it.
Ashby found candidates are roughly 50% less likely to reach the interview stage than they were five years ago. Gem puts interviews up 33% since 2021, with recruiters carrying 13.4 open roles and 93% more applications on teams that are 14% smaller. More screening, more interviews, harsher filters, fewer people to run them.
That is where calibration quietly dies. Under 746 applications a head, must-haves stop being a rubric and become a keyword filter, because a keyword filter is the only thing that scales to the pile. Nice-to-haves get promoted to hard screens just to cut the volume. Real candidates get binned alongside the AI-generated ones, and nobody ever finds out, because a rejected application never argues back.
Why desks still default to inbound
Not laziness. Throughput.
Posting a req costs an afternoon and returns 244 applications. Sourcing 30 of the right people costs a week: market map, org charts, calibration, contact data, a sequence, then the follow-ups. When a recruiter is carrying thirteen live reqs on a team that has halved, post-and-pray is the rational move under the constraint, even though it is the worse channel.
So the fix is not to tell recruiters to source more. It is to make outbound cost less per contact. That is the only version of this advice that survives contact with a real board.
How to run an outbound desk in 2026
Five plays, in the order they pay off:
- Start from a market map, not a job ad. Feeder companies, adjacent orgs, the titles the work actually carries rather than the title on the req. Size the addressable pool before you write a line of outreach. If the pool is 40 people, the search is a mapping problem and no amount of volume will fix it. Our guide to finding passive candidates covers the mapping side.
- Calibrate once, score the whole slate. Write must-haves and nice-to-haves with behavioural anchors, then apply that one rubric to every profile in a single pass instead of re-deciding the bar per candidate at 4pm on a Friday. Consistent scoring is what makes a small outbound slate defensible to a hiring manager.
- Verify contact data before you send. Bounces are charged to your sending domain, not to the list, and a poisoned domain takes weeks to rebuild. Protecting your sender reputation is the cheapest insurance on an outbound desk.
- Sequence, do not single-touch. Gem's outreach data shows four-step sequences pull about twice the replies of a single email, while the first email still captures 58% of all replies. Both facts matter: message one does most of the work, and the follow-ups still carry the other 42% of your replies.
- Mine what you already have. Rediscovered candidates now make up 46% of sourced hires, up from 26% in 2021 (Gem). Past silver medallists and old pipelines in RecruiterFlow, Greenhouse, Lever or TeamTailor are the cheapest outbound list on the desk, and they already know who you are.
What to measure instead of application volume
Application count is now a vanity metric that moves on its own. Swap it for yield metrics that a halved team can actually act on:
- Sourced share of hires. Gem's benchmark is 11%. If yours is 3%, you are running a one-channel desk.
- Slate-to-interview pass-through against your rubric. The health check on calibration.
- Reply rate by sequence step, not per send. It tells you where a sequence is dying.
- Applications reviewed per hire. The cost line you want falling.
- Time to first slate, not time to first application. First application is noise now.
Do not switch inbound off
The flood hides good people as well as bad ones, and 90% of your applications still buy half your hires. The move is triage, not abandonment: run inbound through the same rubric you use on sourced profiles, so the pile gets scored once instead of skimmed daily. Outbound is where you add the yield, not where you replace the funnel.
Want the outbound half of the desk to cost less than a week per search? Instalent builds the slate from a plain-language brief, adds verified enrichment from multiple sources, scores every profile against one rubric in a single pass, and runs the multichannel outreach with the follow-ups built in. Start free, or see how it fits your team. If you want the cost side first, we broke down what candidate sourcing actually costs.
Sources
- Greenhouse - Hiring benchmarks 2026: The Hire Standard (March 2026; 6,000+ companies, 640M+ applications, 2022-2025 data: applications per job 116 to 244, applications per recruiter 146 to 746, team size 10.43 to 4.62, time-to-fill 43.64 to 59.67 days, monthly hires per recruiter 2.2 to 4.9)
- Gem - Key takeaways from the 2026 Recruiting Benchmarks Report (December 1, 2025; 165M applications, 1.2M hires, June 2021 to May 2025: direct sourcing 11% of hires from 2.6% of applications, sourced candidates ~8x more likely to be hired, job boards ~90% of applications and ~half of hires, 0.5% offer rate, 8% pass initial screen, 13.4 open roles per recruiter, 93% more applications than 2021, headcount down 14%, interviews up 33%, rediscovered candidates 46% of sourced hires vs 26% in 2021)
- HR Dive - Recruiters see job applications triple, to more than 300 per role (May 13, 2026, reporting Ashby's May 7, 2026 analysis of 100M+ applications across 200,000 jobs: 300+ applications per open role, applications per hire tripled since 2021, candidates ~50% less likely to reach interview than five years ago)
- Pin - Sourcing Metrics and Benchmarks 2026 (May 10, 2026, updated June 9, 2026; aggregating Gem outreach data: four-step sequences ~2x the replies of a single email, first email captures 58% of total replies)
Keep reading


Find better candidates, faster
See how Instalent helps recruiting teams source and evaluate talent with AI-powered precision.