Reverse Market Mapping: Turn One Job Title Into a Full Client List
Reverse market mapping finds every company that employs a role, then hands you the decision-makers. The market map that used to take a week, built in minutes.
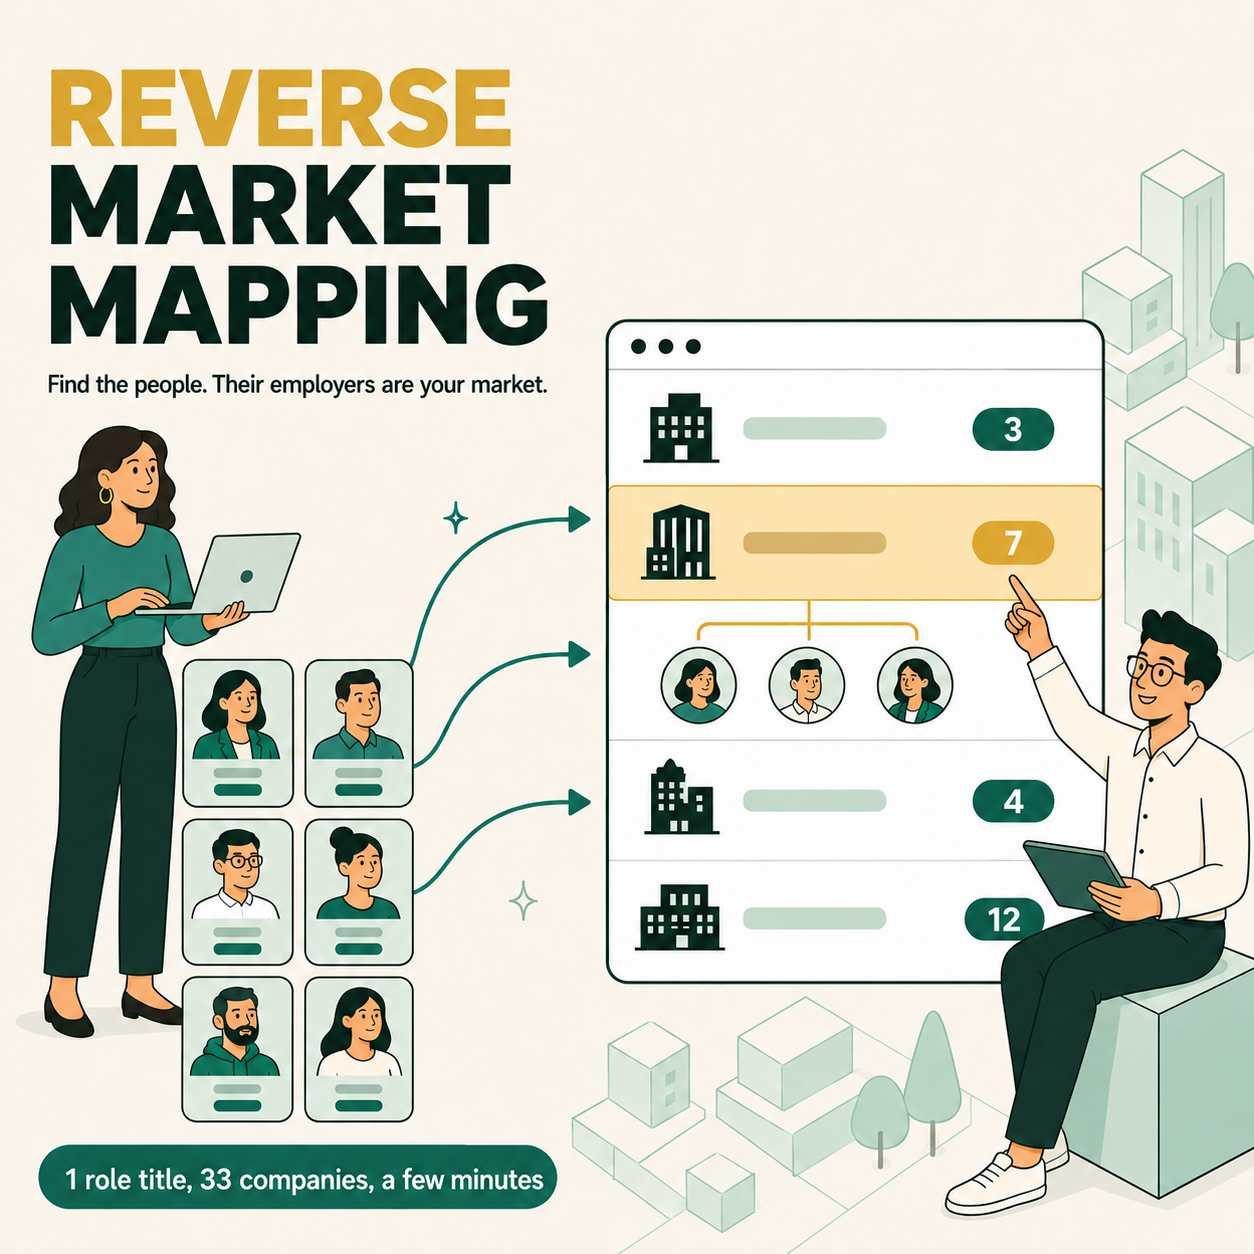
Every desk hits the same question: which companies should I even be calling? The usual answers all start from the company - buy a list, filter a database, scrape the job boards - and then hope the need is there. Reverse market mapping starts from the people instead. Find everyone holding the role in a location, and the companies employing them are your market, by definition.
Market mapping in recruitment is, in Recruiterflow's words, "a structured process focused on researching and organising the talent, companies, and roles in a given niche." Done well it feeds both sides of the desk: a warm candidate pipeline on one side, and on the other a client list good enough to win retained work and position you as a market advisor instead of a CV supplier. Done the normal way it takes a week of somebody's life and is out of date by the next quarter. This post is about running it backwards, which is faster, cheaper and produces a better list.
Market mapping, and why most desks run it backwards
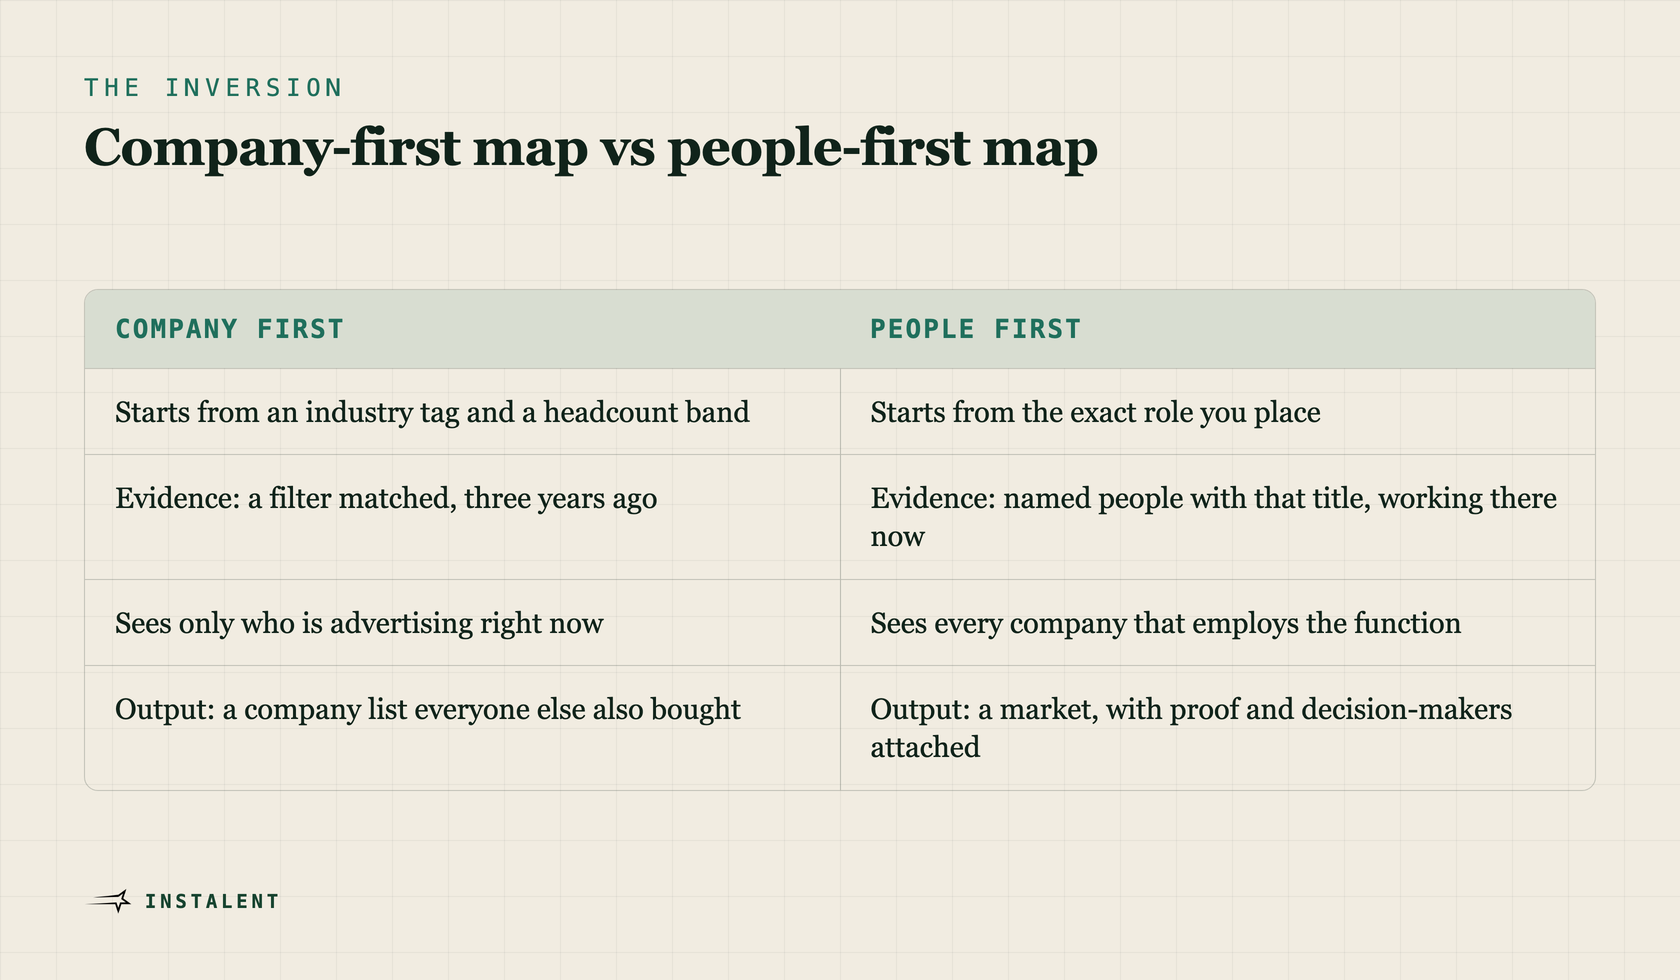
The company-first map is the one everybody has built at least once. Pick an industry and a headcount band, export a list, cross-check the careers pages, scrape whoever is advertising, and start dialling.
It fails in a specific way. A filter tells you a company exists. It does not tell you the company has the need you serve. Industry tags are applied once and rot. Headcount bands lump a 200-person consultancy that employs eighty engineers together with a 200-person retailer that employs two.
The job-board version has the opposite problem: it is accurate but tiny. Only companies advertising right now show up, and that pond is not growing. Indeed's Job Postings Index sat at 101.0 on 30 June 2026 - barely 1% above the pre-pandemic baseline and down 3.7% year over year. Meanwhile Bullhorn's 2026 GRID report, built on responses from nearly 2,300 recruitment professionals, names hiring freezes and budget constraints as the number one obstacle to winning new business, with competition from other firms second.
Read those two facts together and the strategy writes itself. Fewer companies are advertising, and more agencies are chasing the ones that do. If your BD list is "who posted a job this week," you are queuing with everyone else for a shrinking slice of the market.
Why a market map takes a week - and is wrong in six months
Ask anyone who has built one properly. The work is not hard, it is just relentless:
- Guess an initial set of target companies from memory, a database export and a few competitor client lists.
- Open each one and work out whether it actually employs the function you place, and at what depth.
- Rebuild the org chart by hand, one profile at a time, to find who owns the hiring decision.
- Chase a working email or phone number for each of those names.
- Paste everything into a spreadsheet that three people will edit and nobody will maintain.
- Discover halfway through that two of your companies merged and one rebranded.
Executive search firms budget for this openly. Cornerstone Search's 2026 guide describes elite firms beginning market research in weeks 3 to 6 of a search, starting from an initial list of 50 to 100 names and cutting to the 8 to 12 worth a real conversation. That is weeks of a search budgeted for research before anyone is approached. The recruiters we interviewed while building this feature put their own number on it: one to two weeks of work to map a single role in a single city properly.
And then it decays. HubSpot's widely cited figure, quoted by Cognism, is that 22.5% of B2B data goes bad every year - on a 10,000-record list, more than 2,000 rows are wrong within twelve months. Gartner puts the average annual cost of poor data quality at $12.9 million per organisation. Cornerstone's guide puts the shelf life plainly: "If your market map is more than six months old, it is already wrong."
Salespeople pay the same tax. Reps spend just 40% of their time actually selling (Salesforce State of Sales 2026, via SPOTIO), and about 9% of the week on prospecting research alone. That is a full half-day, every week, spent working out who to talk to before anyone gets talked to.
A market map is perishable stock, not an asset
The spreadsheet you spent a week on is worth the most on day one and loses value every week after. That is the real argument for automating it: not that the work is beneath you, but that anything you can only afford to do once a year will be wrong for eleven months of it.
Reverse market mapping: map the market by the people in it
Here is the whole idea in one line.
If you want the companies that employ DevOps Engineers, do not go looking for "tech companies." Go and find the DevOps Engineers. The companies they work at are your market. Then go and get their Heads of Engineering.
You search for the role first. Every person you find carries their employer with them. Group those employers and you have derived a market from evidence rather than assumed one from a tag. Two populations come out of it, and the distinction matters:
- The role-holders are the evidence. They are not your outreach list. They exist to prove which companies belong on the map, and how deep the need runs.
- The decision-makers are the deliverable. Once you know the companies, you go back and find the CTO, the Head of Talent, the VP of Revenue Operations at each one.
The logic is airtight in a way a filter never is. A company employing forty Software Engineers is a company that hires Software Engineers. Not "probably", not "according to a tag someone applied three years ago." You have named people with those titles working there right now. That evidence is the product, and it is what makes the map defensible in a pitch. It also reaches the roughly 70% of the global workforce that is passive (Recruiterflow, 2026), which no job-ad scrape ever will.
What a reverse map gives you that a bought list never will
Proof attached to every company. Each company on the map arrives with the named employees that put it there. When a prospect asks "why are you calling me," the answer is specific and verifiable rather than "you came up in a search."
Depth, not just presence. Three role-holders and thirty are both "a company that employs the function," and they are completely different conversations. The count is a free intensity score, and it sorts your call list for you.
Companies that never advertise. Employing a function is a broader and far more stable signal than advertising for one. A company with twenty-five engineers and no live ad still has attrition, still has growth plans, and still has a hiring manager who will need someone in the next two quarters. You get to be early instead of eleventh.
A list nobody else bought. A database export is available to every competitor with the same subscription. A market derived from live role-holders in your niche is shaped by your own search, and it is different from theirs.
Contacts, not just companies. A company name is not a lead. A named decision-maker with a verified way to reach them is. That last mile is where most manual maps quietly die.
How to run a reverse map in minutes
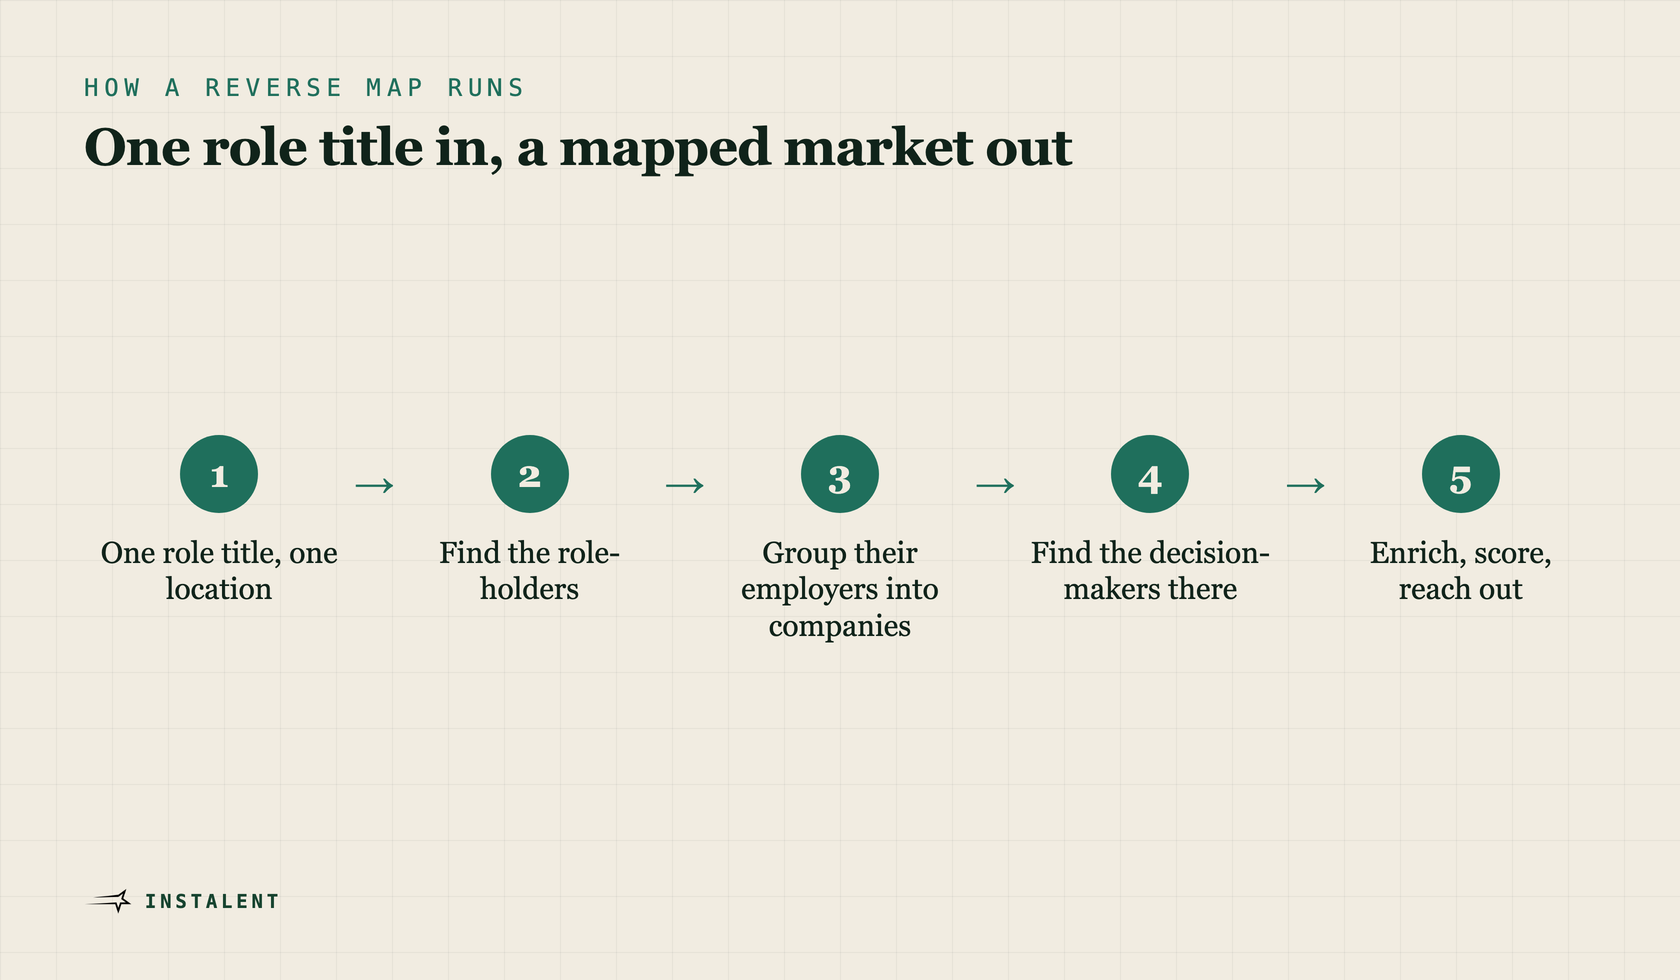
This is what Instalent's Client Map does, and the shape of it is deliberately small. You give it five things:
- One role title - the role that defines the market you serve. One per map, on purpose. Two roles is two markets.
- One to three contact titles - the decision-makers you want to reach. An Enhance button expands "CTO" into its close variants so you do not miss the ones who spell it differently.
- One location - one market per map.
- An industry, optionally, to narrow it.
- A credit budget - the only cap on the run. It stops there. Raise it later and it picks up where it left off rather than starting again.
Then it runs server-side. Close the tab, work a req, come back to a finished market. Phase one finds the role-holders and groups their employers into companies. Phase two goes back into every derived company and finds the people holding your contact titles. Rows stream into the table as they land.
The column that matters is Mapped employees: a count next to each company that expands into the actual named role-holders behind it. That is the difference between a list and a case. "You are on my list because these three Product Managers work for you, and here they are" is a sentence you can say on a call.
From there the map is a normal working table, so the rest of the desk works on it unchanged: verified contact enrichment from multiple sources to unlock corporate emails and direct numbers, scoring against your own criteria to rank who is worth the first call, multichannel outreach with spaced follow-ups, export, or a push into RecruiterFlow, Greenhouse, Lever or TeamTailor.
What that looks like on real numbers
Three runs from our own production, measured on 31 July 2026:
| Map | Budget used | Companies | Contacts | Time |
|---|---|---|---|---|
| Product Manager, Copenhagen | 14.0 credits | 33 | 54 | ~70 seconds |
| Software Engineer, Gothenburg | 8.6 credits | 8 | 11 | ~30 seconds |
| Software Developer, United States | 185.9 credits | 271 | 882 | minutes |
Enrichment on ten of those Copenhagen contacts returned nine corporate email addresses in about forty seconds. A tight city plus a specific role gives you tens of companies in around a minute. A national map gives you hundreds and needs a real budget - it is a different job, and worth knowing which one you are starting.
Set against one to two weeks of manual work per location, the arithmetic is not subtle. The interesting part is not the time saved on one map. It is that a map cheap enough to re-run every quarter stops being a stale spreadsheet and becomes a live view of your market.
Pick the role you place, not the industry you like
The single biggest quality lever is the role title. Map the exact function you actually fill and win on. "Salesforce Administrator" produces a sharp market of companies that clearly need what you sell. "Technology" produces noise. If you place three functions, run three maps and compare which market is densest before you spend a week of calls on the wrong one.
Where reverse mapping does not help
Worth being straight about the limits, because they change how you use it.
It is not exhaustive. A map covers what the sources return inside the budget you set. It is a strong sample of a market, not a census of one.
Employing the role is not the same as buying. It is a much better qualifier than an industry tag, and it is still a qualifier, not a signed contract. Layer your own buying signals on top - funding, a new leader, repeated postings - to decide who to call first.
Some markets are full of consultancies. Map any engineering function and the big services firms will dominate the top of the list, because they employ the most of everyone. Sometimes they are your best client. Sometimes they are your competitor. Decide before you dial.
It replaces the research, not the judgement. The map tells you where the market is. Which company is worth a quarter of your BD time, and what you open with, is still the recruiter's call. The point of automating the first week is to spend it on the second.
The takeaway
Client acquisition is the ceiling on an agency's revenue, and most desks improvise it. Reverse market mapping makes it a repeatable input: pick the role you place, derive the companies that employ it, take the decision-makers, and re-run it when the market moves. Bullhorn found top-performing firms are four times as likely to be using AI, and firms using AI anywhere in the recruitment process 3.5 to 4.5 times more likely to have grown revenue in 2025. This is one of the least glamorous and highest-leverage places to spend it: the week of research nobody enjoys and everybody needs.
Want your market mapped before your next BD block? Instalent derives the companies that employ your niche, hands you the decision-makers with verified contacts, and runs the outreach from the same place. Start free, or see how it works for recruitment agencies. If you are working the client side more broadly, the agency BD playbook and reaching the actual decision-maker pair well with this one.
Sources
- Bullhorn - 2026 GRID Industry Trends Report (February 2026; nearly 2,300 recruitment professionals; hiring freezes and budget constraints the top obstacle to new business; top performers 4x as likely to use AI; AI users 3.5-4.5x more likely to have grown revenue)
- Indeed Hiring Lab - US Labor Market Snapshot, June 2026 (Job Postings Index 101.0 as of 30 June 2026, -3.7% year over year)
- Recruiterflow - Guide to Market Mapping in Recruitment (14 April 2026; definition of market mapping; ~70% of the global workforce is passive)
- Cornerstone Search - How Market Mapping Executive Talent Works: 2026 Guide (market research in weeks 3-6; 50-100 names cut to 8-12; six-month staleness)
- Cognism - What Is Data Decay? (HubSpot: 22.5% of B2B data goes bad each year; Gartner: $12.9m average annual cost of poor data quality)
- SPOTIO - Sales Statistics (2026; Salesforce State of Sales 2026: reps spend 40% of time selling; SPOTIO State of Field Sales 2026: 9% of time on prospecting research)
Keep reading

Find better candidates, faster
See how Instalent helps recruiting teams source and evaluate talent with AI-powered precision.